Reports
Reports builds downloadable Excel workbooks from tracked activity. You choose the report, whose data, and which days; the page shows a real slice of the file before you download it.
Who can open it
Owners, admins, managers, team managers (their team) and reporting managers (their reportees). Viewers don't see Reports: read-only roles can't generate files.
The three reports
| Report | Shape | Range limit | Calendar |
|---|---|---|---|
| Productivity report | One sheet per working day plus a range Summary. Productive vs unproductive time per person. | up to 180 days | Weekends and days off in the working calendar get no sheet. |
| Attendance report | One sheet, people × days: one row per member, one column per day holding that day's productivity score, plus a Productivity (%) column. | up to 45 days | Every day becomes a column; non-working days show WO. |
| App usage report | A Summary plus one sheet per day: time per application for each person. | up to 31 days | No calendar filter; weekends and holidays included. |
Building a workbook
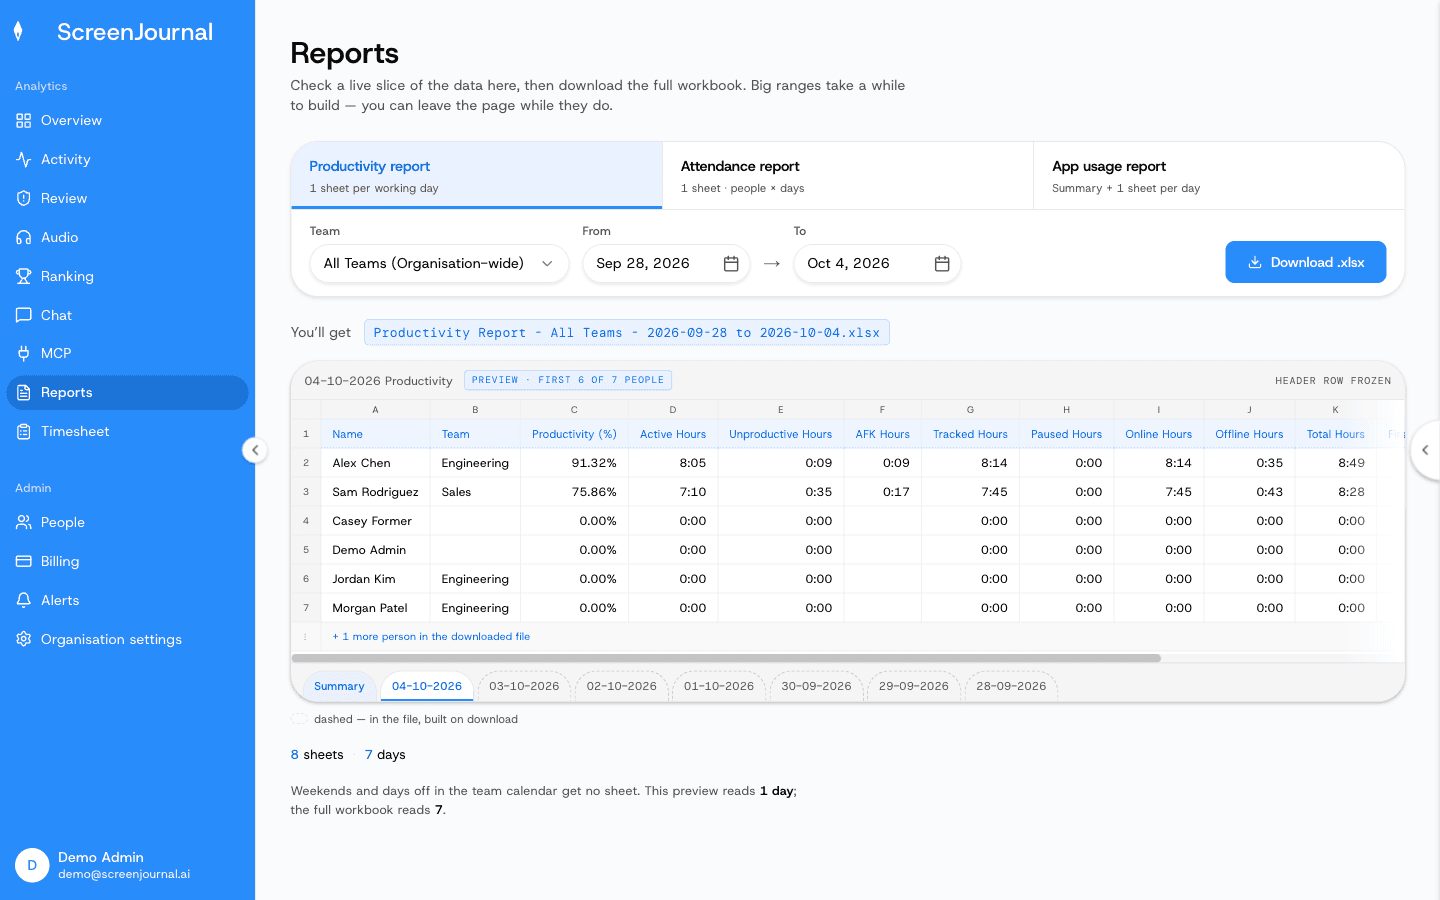
What you see: a toolbar with the report chooser, a scope picker and a date range, then a preview of the sheet and a manifest of what the file will contain.
What to do:
- Choose the report.
- Choose the scope: a team, All Teams (Organisation-wide), or — for a reporting manager — your reportees.
- Pick the date range. Arriving from Overview's Download reports button pre-fills the range you were looking at. A range past the report's limit is refused with an explanation before anything is fetched.
- Read the preview. It shows the first people and one settled day (one week for attendance) of exactly the data the download will contain. Hover a column header for its definition and formula.
- Download .xlsx. The filename carries the scope and the range (or the month, for a whole-month attendance report).
What the columns mean
Hours columns follow the shared definitions in The Web Dashboard: Active, Unproductive (idle time is inside it, so hour columns don't sum to Tracked), Productive Manual Hours (inside Active), Tracked = Active + Unproductive, Paused, Online = Tracked + Paused, Offline, Total = Online + Offline, First Login / Last Logoff, and First Tracked / Last Tracked (the first and last real recorded activity, which can be blank). Productivity (%) is weighted productive hours ÷ 8-hour workday × 100.