Ranking
Ranking is the weekly league table. The week runs Monday to Sunday in the organisation timezone.
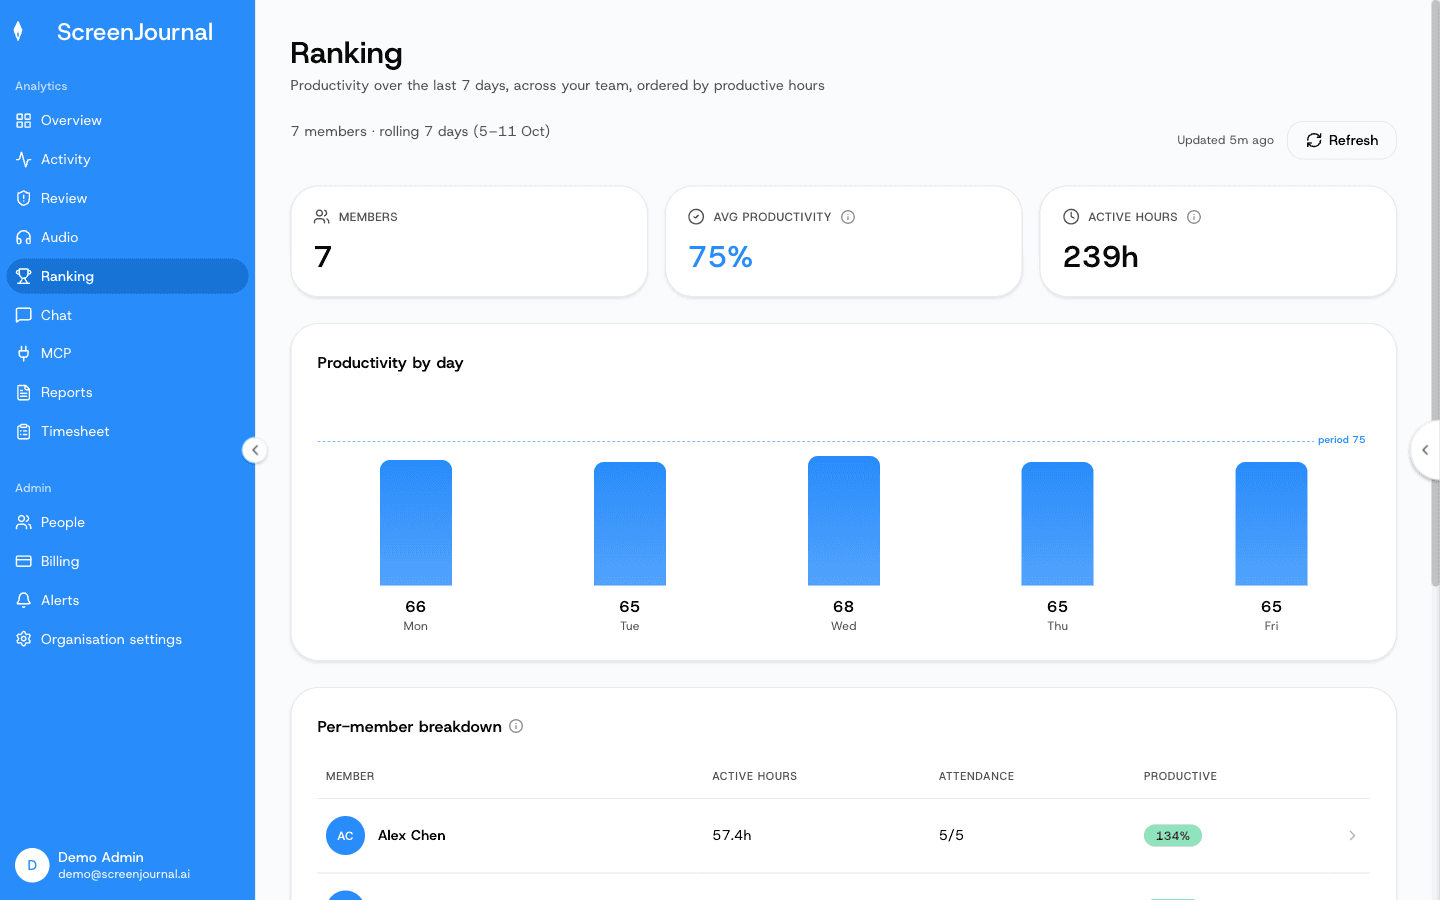
What you see: three cards — Members, Avg Productivity and Active Hours for the week — a Productivity by day bar chart with a dashed team-average line, and a Per-member breakdown table with Member, Active Hours, Attendance (days present out of working days) and Productive (%). The header shows the week, when the figures were last computed ("Updated 12m ago") and a Refresh button. The PDF / Excel / Share buttons are marked coming soon.
Who can open it
Anyone who can see other members' activity: owners, admins, managers, viewers, team managers (their own team) and reporting managers (their reportees). Others get a notice instead of the table.
Member drill-down
Select any row to open that member's week:
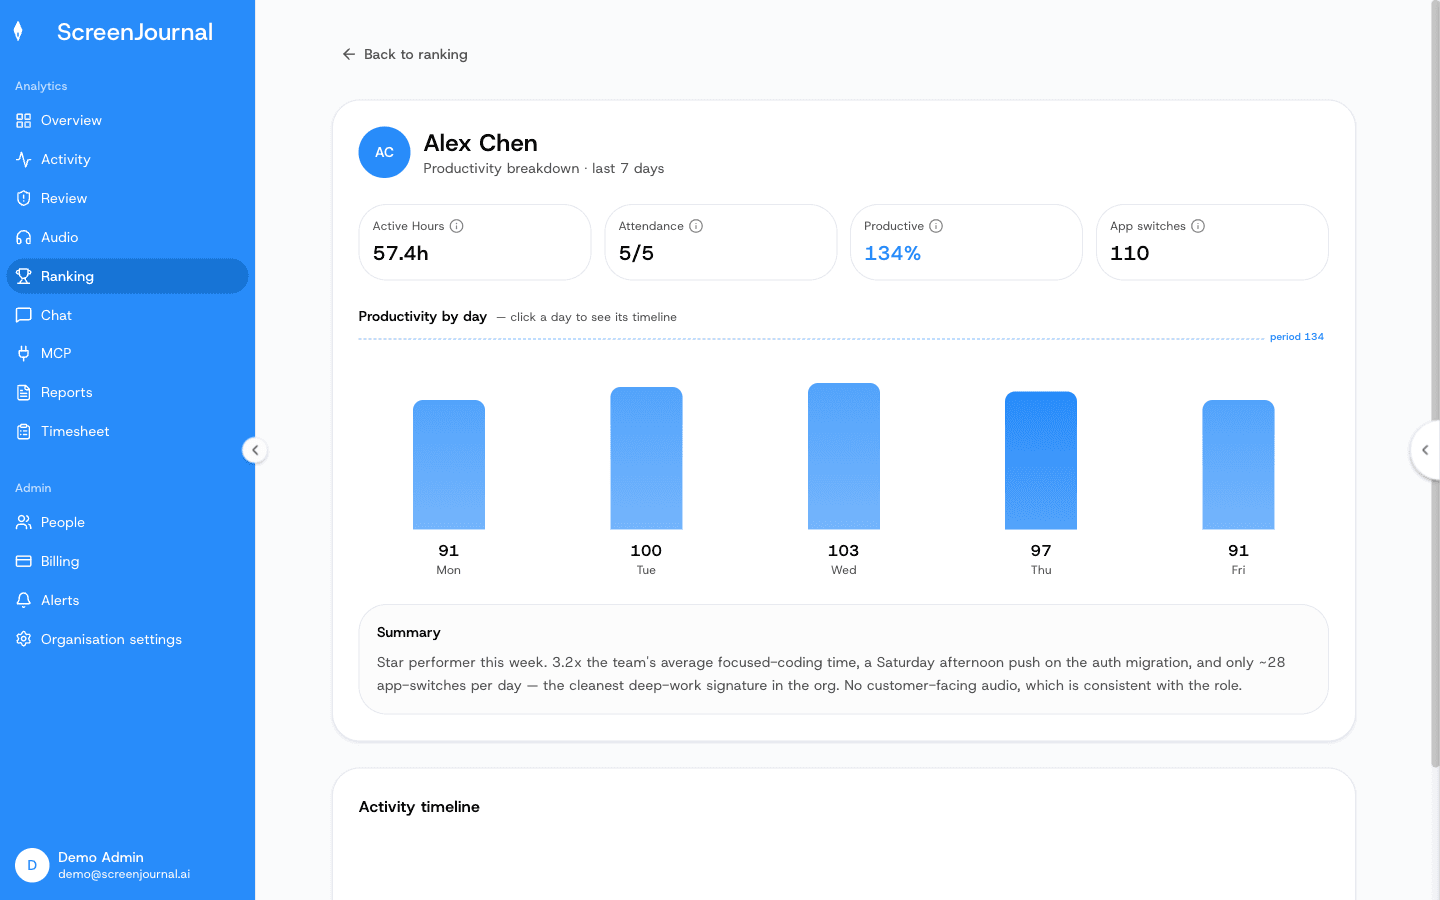
What you see:
- Headline stats — Active Hours, Attendance, Productive and App switches.
- A Productivity by day chart for that member, with the average line.
- A Summary written by the AI comparing the member's week with the team. Viewers don't trigger summaries (read-only means no generation).
- Activity timeline — click a bar in the chart to load that day's full timeline right there on the page, with day navigation. It's the same timeline as the Activity page, including score corrections for admins.
How the numbers are built
Productive (%) and Active Hours follow the shared definitions in The Web Dashboard. Attendance counts working days from the working calendar, so a Saturday that isn't a working day never counts as an absence. Rankings are computed on demand and cached for up to an hour; Refresh recomputes them.