Overview
Overview is the first page after you sign in. It answers "how is the team doing?" for a day, a week, a month or a custom range, and it is where you drill from the team to a person to a single day.
Choosing what to look at
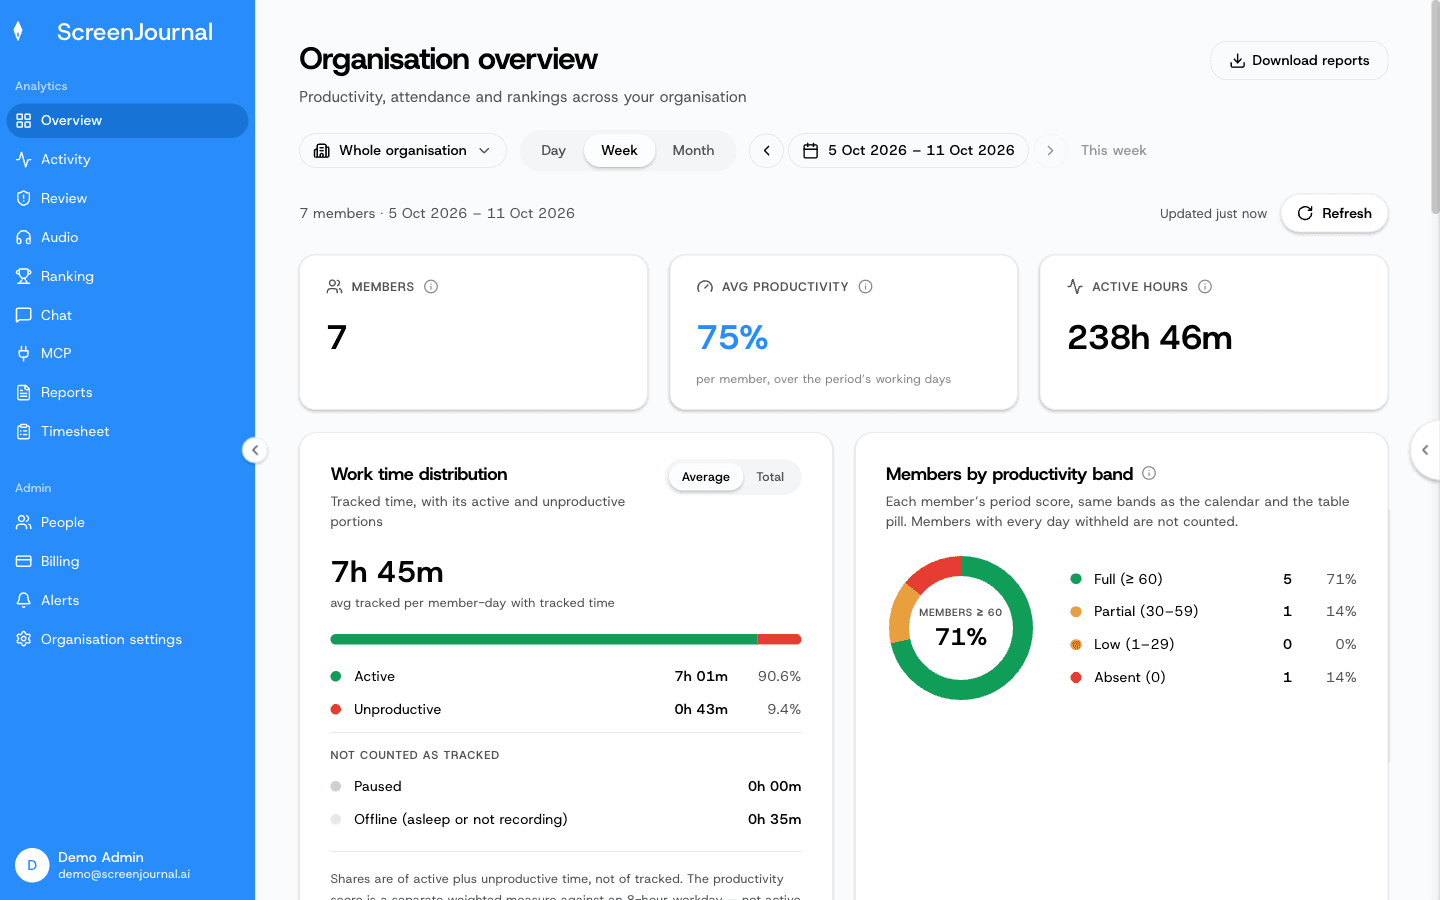
What you see: the heading says which scope is on screen — Organisation overview or Team overview — followed by a toolbar.
What you can do:
- Switch the period with Day / Week / Month, step with the arrows, or pick a date. A custom range (for example the last 7 days) is available too. The period is in the page address, so a link you copy opens on the same view.
- Change scope: Whole organisation, one team, or a single member. A team manager sees "Your team · "; a reporting manager sees their reportees.
- Download reports opens the Reports page with the same range pre-filled.
- The summary line under the toolbar shows how many members are included and when the figures were loaded, with a refresh control.
The team dashboard
Reading top to bottom:
- Headline figures — Members, Avg productivity (the mean of every member-day that carried a score; days with no activity are left out rather than counted as zero, and the tooltip says how many members contributed) and Active hours.
- Work time distribution — tracked time split into Active, Unproductive, Paused and Offline / asleep, shown as an Average per member per day or as a Total. The productivity score is a separate weighted measure, not active ÷ tracked (see how productivity is measured).
- Productivity bands — how many members fall into Full (≥ 60), Partial (30–59), Low (1–29) and Absent (0).
- Attendance calendar — a month grid where every cell folds the whole scope into one colour: Full, Partial, Low, Absent, Non-working day (grey, from the working calendar) or Withheld (too few people to show without identifying someone). Upcoming days are dashed. Click a day to switch the page to that day.
- Presence matrix — one row per member, one column per day: Paused, Offline / asleep, or Absent · no session on a working day. Click a name to open the member, or a cell to open that member's day.
- App usage — where tracked time went, by application, with Tracked in apps, Apps tracked and Most used, and a bar per app. Shares are of tracked time.
- Per-member breakdown — a sortable table with Member, Productivity, Active, Unproductive, Tracked, Paused, Offline, Total, First login, Last logoff. Click a row to open that member.
One member
Selecting a member (or landing here as an employee) opens their own screen for the same period:
What you see: their headline figures, work-time split, app usage, attendance calendar, and a daily report table — one row per day with the same columns as the team table — plus a Download Excel button that builds that member's workbook for the period.
Days a member paused or was offline are listed under the calendar with the time and duration of each break.
Who sees what
Everyone with dashboard access has an Overview. Owners, admins, managers and viewers get the organisation; team managers get their team; anyone with reportees gets their reportees; an employee with nobody reporting to them is taken straight to their own member screen. Numbers follow the organisation timezone and the working calendar.