Why Weekly AI Reports Beat Real-Time Dashboards
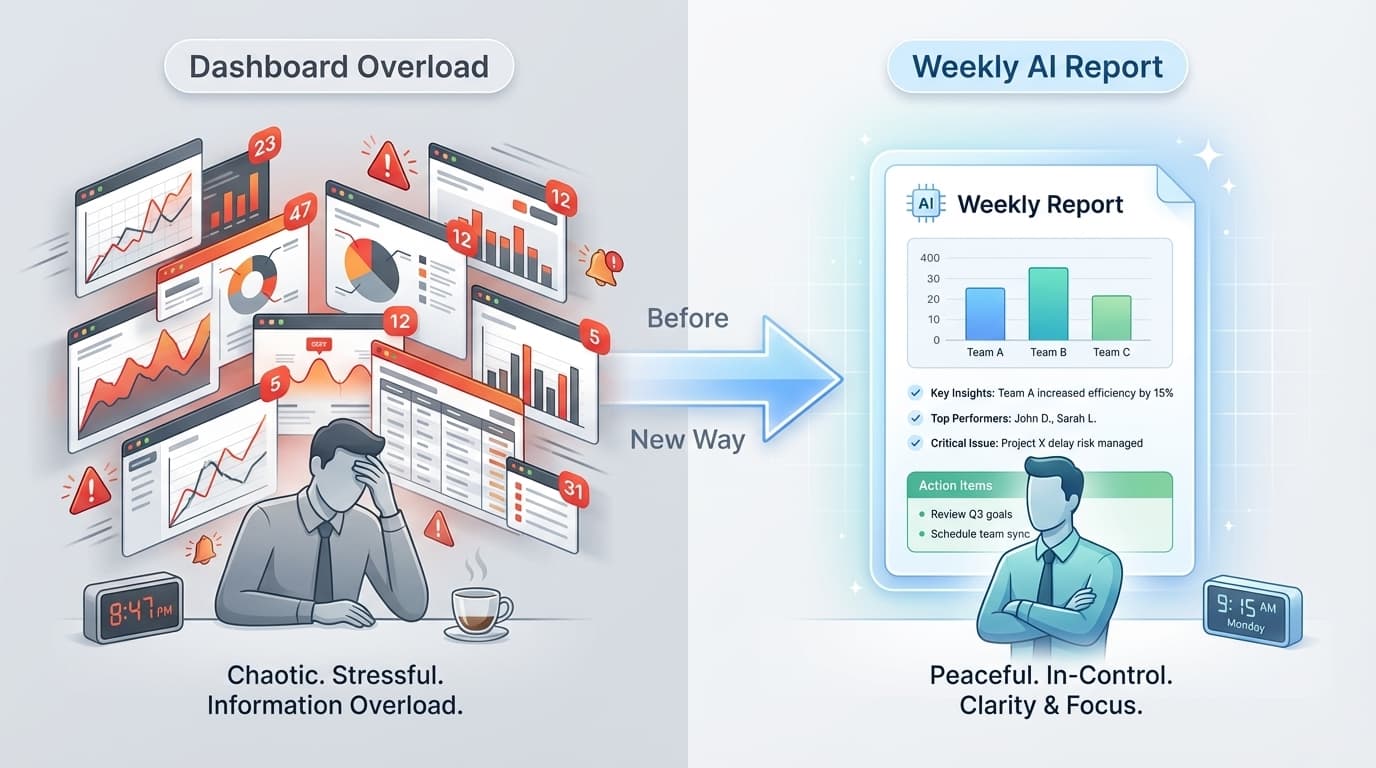
Dashboards promised visibility. They delivered data overload. Here's why switching to weekly AI-generated reports transforms how managers actually manage.

Every employee monitoring tool sells you on dashboards. Real-time visibility! Live activity feeds! Instant insights!
Then reality hits: you have 47 browser tabs open, three different monitoring dashboards running, and no idea what's actually happening with your team.
Dashboards show you everything. AI reports tell you what matters.
The Dashboard Problem
Information Overload
A typical monitoring dashboard shows:
- Real-time activity status for each employee
- Application usage breakdowns
- Time tracking summaries
- Screenshot galleries
- Activity graphs
- Alert notifications
For a 50-person team, that's thousands of data points updated constantly. The human brain can't process it. So what happens?
Managers either:
- Check dashboards obsessively (micromanagement, time waste)
- Ignore dashboards entirely (defeats the purpose)
- Cherry-pick random data points (incomplete picture)
None of these outcomes justify the tool's existence.
The Interpretation Burden
Raw data requires interpretation. Every dashboard visit demands:
- "What am I looking at?"
- "Is this normal or concerning?"
- "What should I do about it?"
- "How does this compare to last week?"
- "Is this person struggling or just having an off day?"
Managers aren't data analysts. They're people managers. Forcing them to interpret raw metrics steals time from actual management.
The Surveillance Trap
Real-time dashboards create unhealthy dynamics:
For managers:
- Temptation to check constantly
- Focus on individual moments instead of patterns
- Reactive management based on snapshots
- Time spent monitoring instead of leading
For employees:
- Awareness of constant watching
- Anxiety about real-time status
- Performative behavior over genuine productivity
- Eroded trust and autonomy
The Weekly Report Revolution
From Raw Data to Actionable Intelligence
ScreenJournal's approach: AI analyzes everything, then delivers a curated weekly digest.
What you receive every Monday:
Team Rankings
Not just numbers - explanations:
"Alice ranked #1 this week (Effort Score: 92). Key factors: maintained 4+ hour focus blocks daily, minimal context switching, exceeded schedule adherence. Consider for team lead opportunities."
"Eric dropped to #8 (Effort Score: 58). Notable change: logged off before 4pm four days this week, 40% increase in non-work application time. Recommend: casual check-in to understand circumstances."
Risk Alerts
Specific, contextual, actionable:
"🔴 Burnout Signal: Ben logged 58 hours this week, with activity past 11pm on four nights. This is the third consecutive week of overwork. Immediate intervention recommended."
"🟡 Attendance Pattern: Grace missed first hour on three days. Pattern suggests morning routine conflict. Consider flex schedule discussion."
Anomalies Detected
Unusual patterns worth investigating:
"Hazel's context switches increased 3x this week (45/hour vs typical 15/hour). Possible causes: project complexity, distractions, or tool issues. Worth discussing."
Recommendations
AI-generated action items:
"Based on team patterns, consider implementing 'Focus Fridays' with reduced meetings. Data shows 40% higher deep work scores on low-meeting days."
Why Weekly Cadence Works
1. Patterns Over Moments
Daily fluctuations are noise. Weekly patterns are signal.
| Daily Data | Weekly Insight |
|---|---|
| "Low activity Tuesday afternoon" | "Consistently productive with Tuesday dip - likely meetings" |
| "High overtime Wednesday" | "Occasional crunch, within healthy range" |
| "Lots of Slack usage Monday" | "Standard week-start coordination, then focus improves" |
One day's data is unreliable. A week's pattern tells the truth.
2. Time to Act
Real-time alerts demand immediate response. But most issues don't need immediate response - they need thoughtful response.
Weekly reports give you:
- Time to review thoroughly
- Space to consider context
- Opportunity to plan conversations
- Ability to batch similar issues
3. Natural Management Rhythm
Most managers already work in weekly cycles:
- Monday planning
- Weekly team meetings
- Friday wrap-ups
- Weekend reflection
Weekly reports align with how management actually works, not how dashboards imagine it works.
4. Reduced Anxiety (Both Sides)
Managers: Check one report weekly instead of dashboards daily Employees: Evaluated on weekly patterns, not moment-to-moment surveillance
Both parties can focus on actual work instead of the monitoring system.
What You're NOT Missing
"But what about urgent issues?"
Truly urgent issues surface through normal channels:
- Employee reaches out
- Deadline is missed
- Client complains
- Work product quality drops
You don't need a dashboard to know when something's actually wrong. You need a report to know when something's subtly off.
"What if someone's slacking all week?"
They'll appear in your weekly report:
- Low Effort Score
- Anomaly flags
- Comparison to team average
One week of underperformance documented with full context is more useful than five daily alerts you dismissed.
"Don't I need real-time for accountability?"
Real-time monitoring creates surveillance. Weekly reports create accountability.
The difference:
- Surveillance: "I'm watching your every move"
- Accountability: "I'll know how your week went"
Which relationship would you rather have with your team?
The Numbers
Manager Time Savings
Dashboard approach:
- 30 min/day reviewing dashboards
- 15 min/day interpreting alerts
- 45 min/day × 5 days = 3.75 hours/week on monitoring
Weekly report approach:
- 30-45 min reviewing AI report
- Time to act on specific issues
- ~1 hour/week on monitoring
Savings: 2.5+ hours per week returned to actual management.
Decision Quality
A study of monitoring-based decisions found:
- 67% of dashboard-triggered interventions were unnecessary
- 23% addressed symptoms instead of causes
- Only 10% led to meaningful improvement
With weekly AI reports:
- AI filters noise before presentation
- Patterns contextualize individual data points
- Recommendations based on broader analysis
Result: Fewer, better interventions.
Making the Transition
If You're Currently Dashboard-Dependent
Week 1: Add ScreenJournal alongside existing tools
- Continue dashboard routine
- Read weekly report when it arrives
- Compare insights
Week 2: Reduce dashboard checks
- Check dashboards once daily instead of constantly
- Note what weekly report caught that you missed
- Note what dashboard showed that didn't matter
Week 3: Dashboard detox
- Check dashboards only for specific investigations
- Rely on weekly report for regular oversight
- Measure your own stress levels
Week 4+: New normal
- Weekly report is your primary tool
- Dashboards available for deep dives when needed
- Focus time returns to management
If You're Starting Fresh
Skip the dashboard phase entirely. Start with weekly AI reports and:
- Never develop dashboard dependency
- Set healthy management patterns from day one
- Model trust-based oversight for your team
The Mindset Shift
Dashboards assume managers want to watch.
Weekly AI reports assume managers want to understand.
Watching is exhausting, invasive, and often ineffective. Understanding is efficient, respectful, and actionable.
The best managers aren't the most watchful. They're the most informed - at the right time, with the right context, ready to take the right action.
Stop guessing. Start knowing.
Let AI turn screen data into clear insights. Start your 2 months free trial
Related Posts
How AI Detects Employee Burnout Before It's Too Late
Burnout doesn't announce itself. But the warning signs hide in work patterns - patterns AI can detect weeks before breakdown. Here's how proactive monitoring protects your team.
How AI Voice Analysis Transforms Call Center QA
Manual QA reviews 2-5% of calls. AI analyzes 100%. Learn how ScreenJournal's voice analysis replaces random sampling with comprehensive quality intelligence for call center teams.

ScreenJournal vs. ActivityWatch: From Logger to Analyst
ActivityWatch logs window titles locally. ScreenJournal adds AI screen analysis, voice monitoring, and team analytics for business workforce intelligence. Compare privacy models, features, and use cases.